Function
Appearance
Scaling
1 1 1Camera Controls
Actions
×
Graph Settings
×
Export Graph
A 360° rotation will be created with the current view as a starting point.
×
3D Grapher Help
Navigation Controls
- Rotate: Click and drag
- Zoom: Scroll or pinch gesture
- Pan: Right-click and drag or Shift + drag
Keyboard Shortcuts
- R: Reset camera position
- A: Toggle auto-rotation
- F: Toggle fullscreen
Equation Syntax
Use standard JavaScript math syntax with variables x and y:
Basic Operations:
- Addition:
x + y - Subtraction:
x - y - Multiplication:
x * y - Division:
x / y - Exponents:
x^2orx**2
Available Functions:
- Trigonometric:
sin(x),cos(x),tan(x) - Inverse trig:
asin(x),acos(x),atan(x) - Hyperbolic:
sinh(x),cosh(x),tanh(x) - Exponential:
exp(x)(e^x) - Logarithmic:
log(x)(natural log),log10(x) - Other:
sqrt(x),abs(x),sign(x)
Constants:
piorPI: 3.14159...eorE: 2.71828...
Example Equations:
| Equation | Description |
|---|---|
sin(x) * cos(y) |
Simple wave pattern |
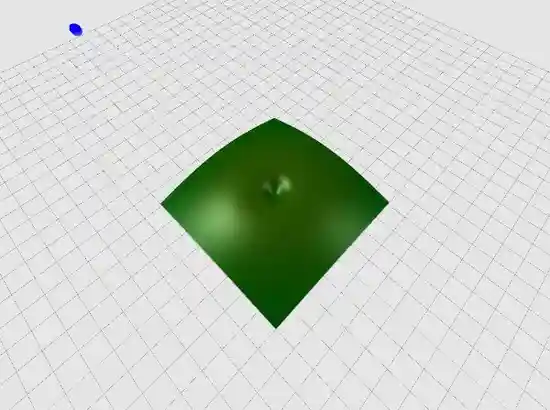
x^2 + y^2 |
Paraboloid |
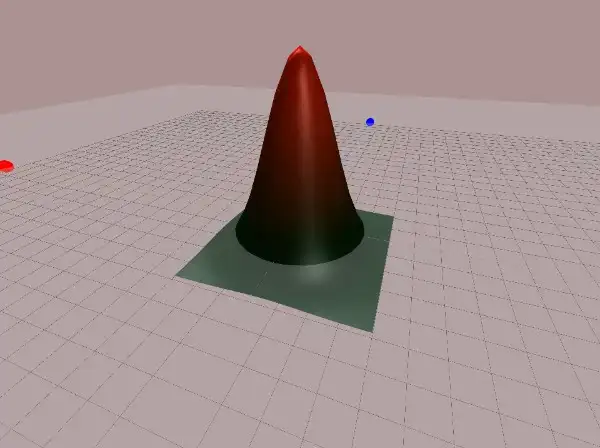
sqrt(x^2 + y^2) |
Cone |
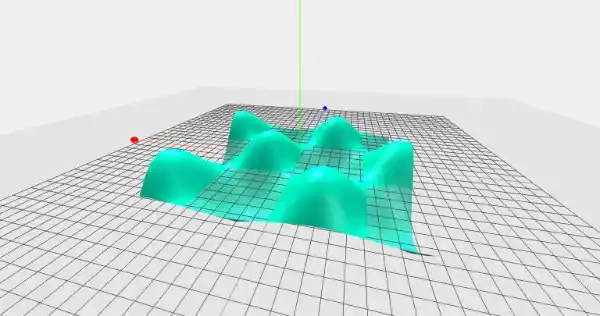
sin(sqrt(x^2 + y^2)) |
Circular ripples |
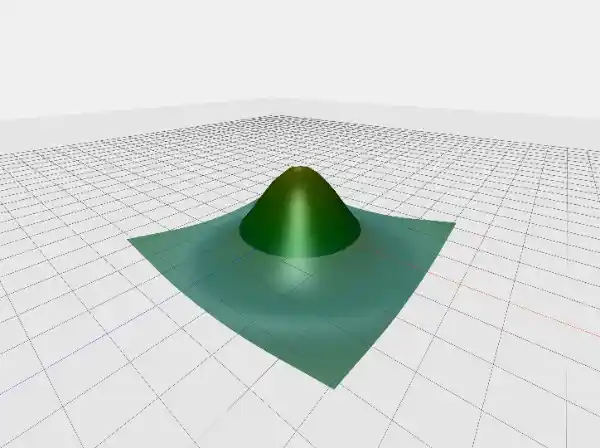
exp(-(x^2 + y^2)) |
Bell curve |
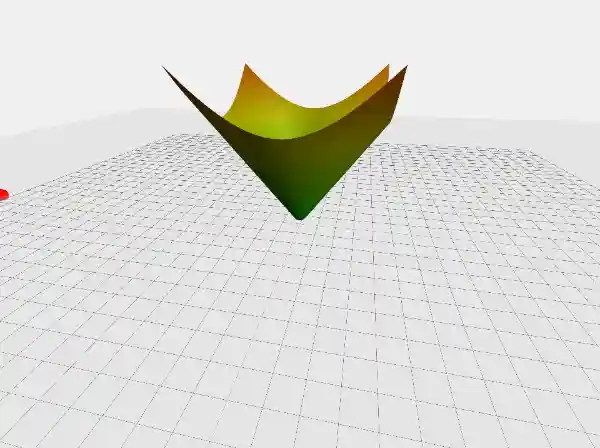
x^3 - 3*x*y^2 |
Monkey saddle |
Tips
- Adjust the Resolution for smoother graphs (higher values) or better performance (lower values)
- Use Scaling to stretch or compress the graph along different axes
- Try Height-based color mode to visualize function values with colors
- Use Auto-rotate to see the graph from all angles
- Click Share Equation to generate a URL that contains your custom equation
×
About 3D Grapher
3D Grapher is an interactive tool for visualizing mathematical functions and equations in three dimensions. It allows you to explore various mathematical surfaces and create beautiful visualizations.
Features
- Plot custom mathematical functions in 3D
- Adjust resolution and coloring modes for different visual effects
- Interactive camera controls to explore from any angle
- Export graphs as images or animated GIFs
- Share links to specific equations with customized settings
- Dark mode for comfortable viewing
- Axis scaling to emphasize different dimensions
This tool is open source and available on GitHub. Contributions and feedback are welcome!
×
Equation Examples
×
Share
Share the main 3D Grapher tool with others
Share the current equation and all settings